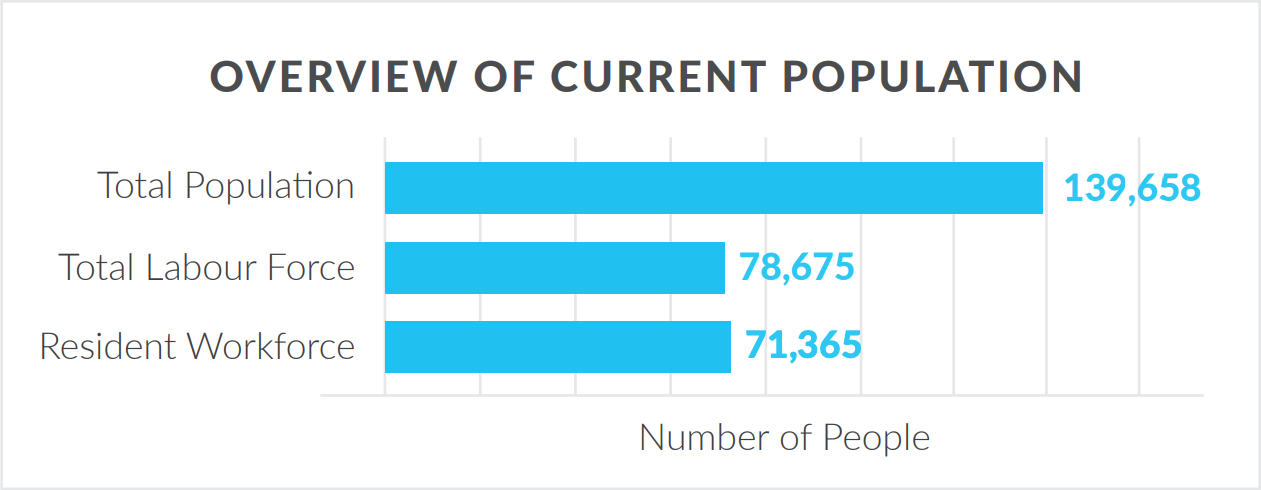
Overview
Since 2011, the population the region of North Vancouver has grown by 3.5%. This increase means North Vancouver has the human capital to meet overall industry needs. In addition to population growth, the numbers of jobs increased by an estimated 6% between 2016 and 2018.
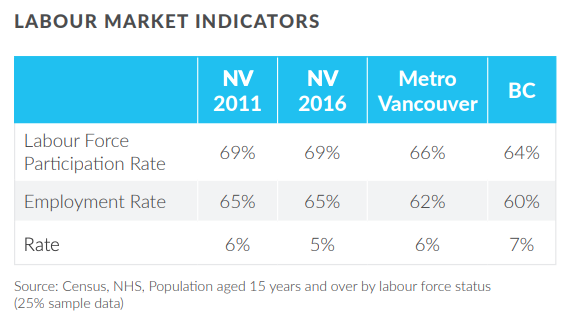
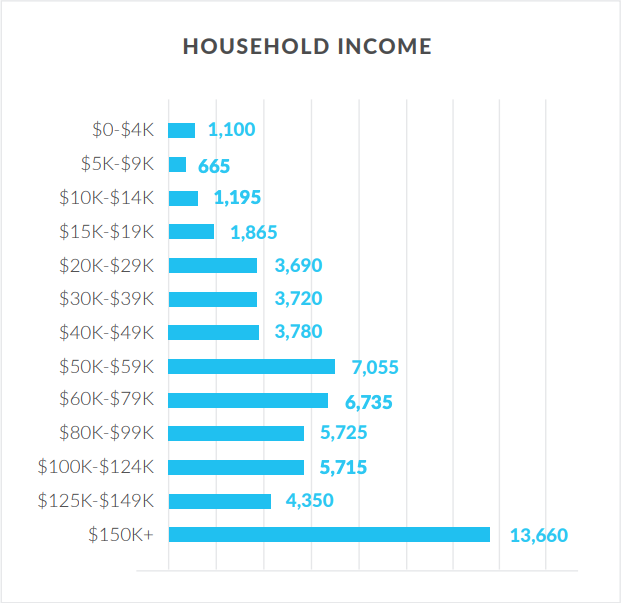
North Vancouver is home to an educated population, with a high labour force participation rate and a low unemployment rate, as well as a median household income of $103,981.
The biggest driver of population growth continues to be immigration, representing 34% of North Vancouver’s total population. Between 2011 and 2016, the immigrant population grew almost three times more than the non-immigration population. With 30% originating from Iran, it is considered the main source for new immigrants.
North Vancouver contains approximately 80 jobs for every 100 employed residents. In other words, it is a net exporter of 20% of its workforce. As a result, local businesses who offer residents shorter commutes create attractive opportunities for employment in North Vancouver.
Quick Takeaways
-
Labour Force Participation Rate: 69%
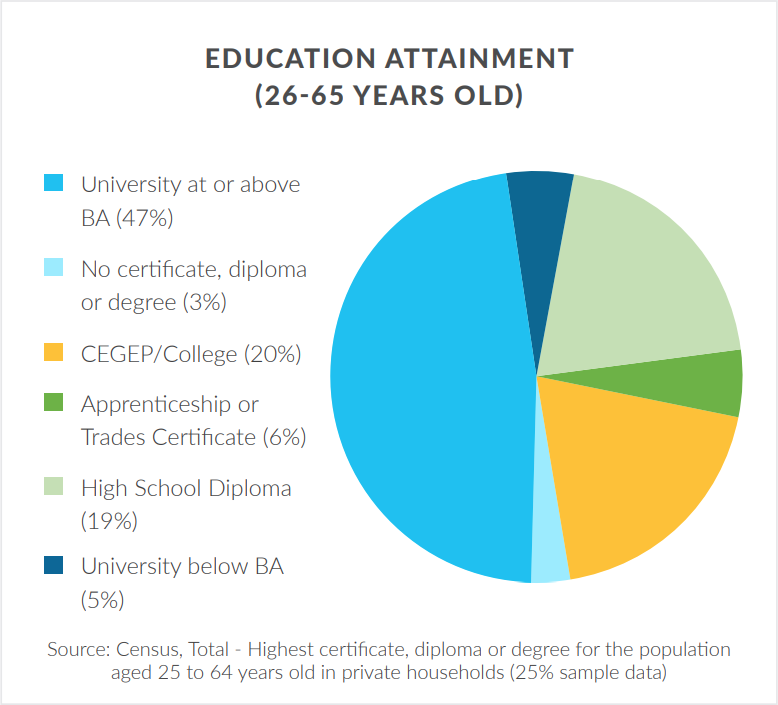
- 47% of North Vancouver residents age 25 to 64 years hold a university certificate, degree, or diploma at a bachelor level and above. This is substantially higher than the Metro Vancouver average of 37.5% for postsecondary attainment.
-
Employment Rate: 65%
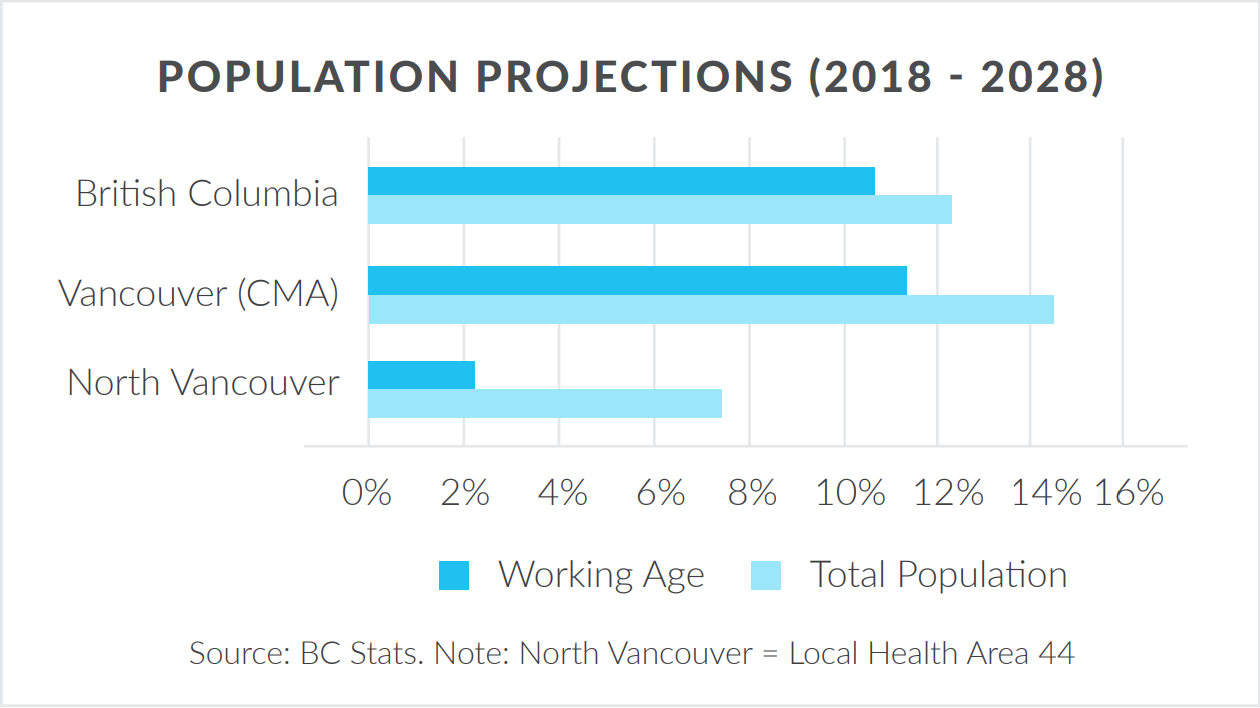
- The 10-year projections (2018-2028) for the region foresee positive population growth, but at a slower rate – just over 2% compared to the metro Vancouver region, which is predicted to grow at a rate of over 11%.
Employment by Sector
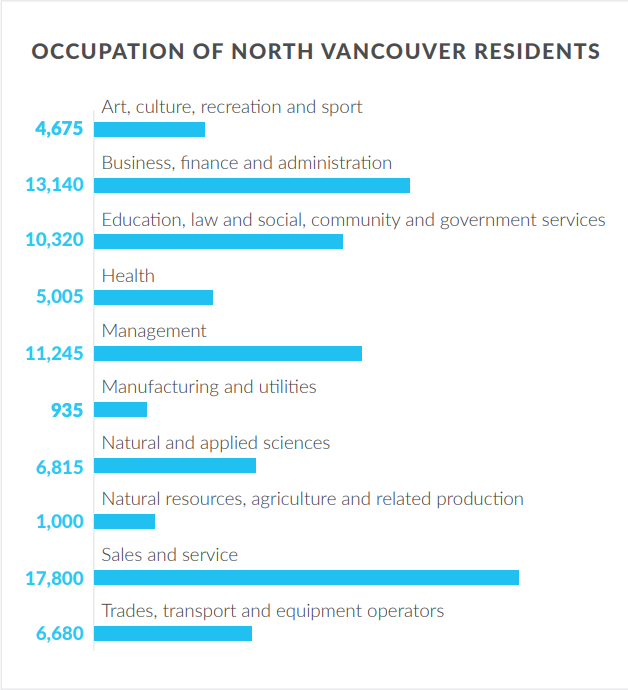
- The top three occupations for the residents in the region of North Vancouver are sales and service (17,800 residents), business, finance, and administration (13,140 residents), and management (11,245 residents).
- The fastest growing occupations between 2011 and 2016 were in arts and recreation, in manufacturing and utilities. Natural and applied science occupations have a strong and growing labour pool as well.
- The most concentrated occupations are in management, art, culture, recreation, and sport.
Credentials (undergraduates, graduates, doctorates and masters)
- 47% of North Vancouver residents ages 25 to 64 years hold a university certificate, degrees, or diploma at a bachelor level and above in 2016. This is substantially higher than the Metro Vancouver average of 37.5% for post-secondary attainment.
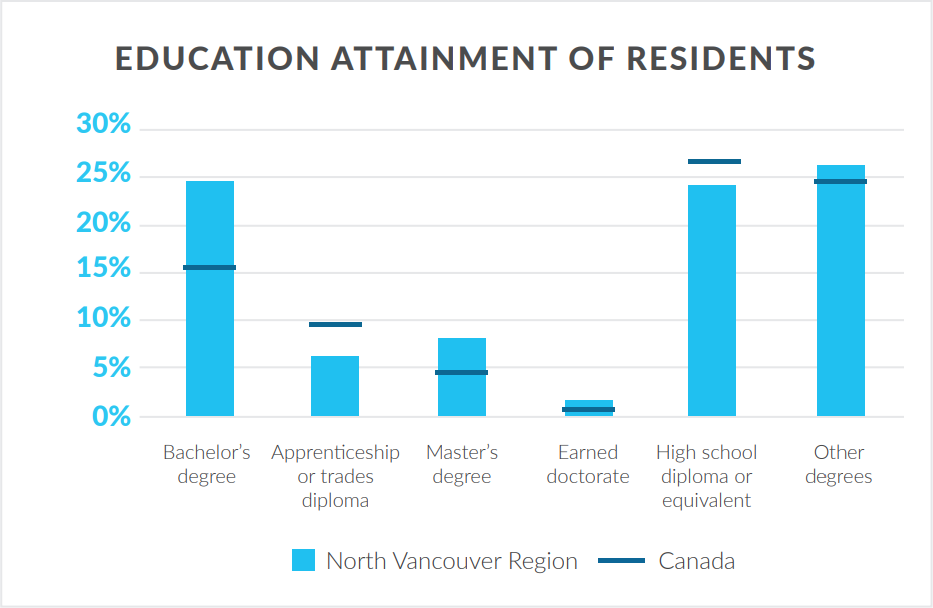
- Residents frequently attend post-secondary school with 24.5% of the population earning a Bachelor’s degree, 9% higher than the population of B.C.
-
The workforce is further strengthened and supported by many renowned educational facilities in a vast array of fields:
- Capilano University
- Marine Campus of the British Columbia Institute of Technology (BCIT)
- The Greta and Robert H.N. HO Psychiatry & Education Centre, (The HOpe Centre)
- UBC Faculty of Medicine teaching program at Lions Gate Hospital
- The Think Tank Training Centre
- Digital Media Academy at Argyle Secondary
Unemployment Rates
- The North Vancouver unemployment rate dropped slightly from 6% to 5% between 2011 and 2016, below the metro and provincial average.
- Median household income: $103,981
- Most residents at North Vancouver are above the low-income cut-off, or the income a person must earn to be considered to be part of the low-income group.
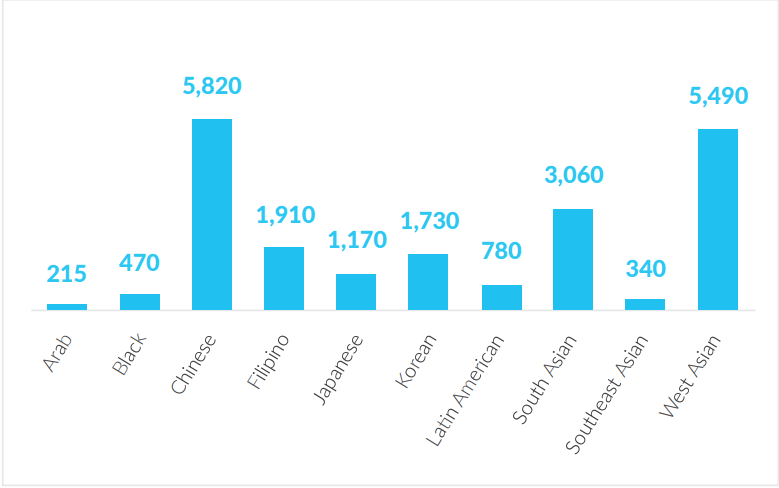
Economic Inclusion
- Immigrant population: 20,985
- The largest immigrant populations are West Asian, primarily Persian, making up close to 30% of the total immigrant population. The second largest group is Filipino, making up 3,450 people. Following Filipino is Chinese – 14.57% of the immigrant population.